One of the hard things about setting metrics for website performance is that there is so much variation, and so many variables, that it’s hard to say what’s normal or what might be a good result. Google’s most recent bench marks report showed that the average website loses a little traffic year over year, and a recent study of 500 major CPG brands found that nearly all had reduced traffic year over year, so there’s a sense in which that’s the norm.
On the other hand, the same report claimed that the Oreo cookies website saw a 7,000%+ increase in traffic year over year during its 100th anniversary. So you could just conclude that you’ll see results somewhere between those two poles.
We are therefore always delighted when we get a chance to look at two websites from the same company. A Plus Educational gave us that chance a few years ago (read the report) and now Hyperdyne Systems has given us the opportunity with their two websites.
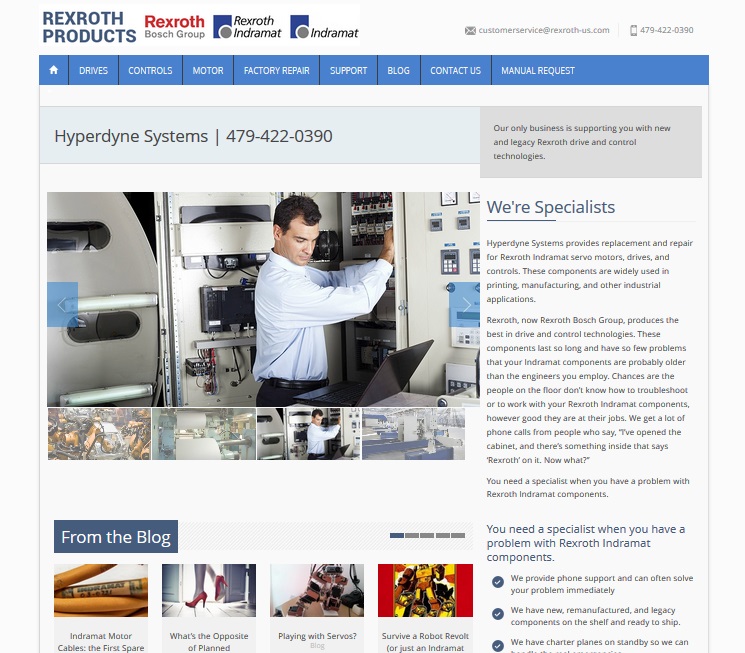
Hyperdyne has two websites which had literally identical content and nearly identical designs when we met them a couple of years ago. We did a live refresh on one to avoid duplicate content and the owners had another firm update their code though not their design. This spring, they let us rebuild the other website and add a blog. Still, the two websites remain very similar: the same company, the same domain age, the same offerings, the same conversion points, and similar though not identical content. Both have current code. One has a new design and a blog, but neither has social media management.
In the Quarter 3 analytics reports for the new website, I was pleased to see great improvements over the previous quarter:
- A 21.12% increase in traffic overall
- A 72.17% increase in organic search traffic
- A 23.62% increase in unique visits to the Contact Us page
While the site is designed to bring conversions in the form of phone calls and the phone number is on every page, visits to the Contact Us page are signals of intent to purchase services. We also saw an increase in visits to the manuals request page and even in social traffic, though the company is not active in social media at all.
These are nice results. Then I had a look at the other website for the same time period. Here’s what I saw:
- A 4.86% increase in traffic overall
- A 12.65% drop in organic search traffic
- A 12.14% increase in visits to the Contact Us page
The results of the site with a blog were much better than the results of the site without.
When I asked Scott Jernigan, the owner of Hyperdyne, for permission to share this case study with you, he pointed out another difference between the two sites. Each site has a domain name containing one of his top keywords. Google no longer pays much attention to this factor, but they used to. The site which has been unattended since its Live Refresh a couple of years ago contains the word “Indramat” and the website we redesigned this year contains “Rexroth.” Scott felt that this might be the explanation — Rexroth is increasing in popularity as a keyword, while Indramat is decreasing.
Good point. So we checked the keyword results (Google was still sharing that data during the time period we’re examining).
The Indramat, or blogless website:
- Visits via the keyword “indramat” decreased by 24.64%.
- Visits via the keyword “rexroth” increased by 8.09%.
It does appear that the term “rexroth” is becoming more important while “indramat” is becoming less so. Is this the explanation of the difference in performance between the two websites?
No. Look at the data for the redesigned website.
The Rexroth, or blogging website:
- Visits via the keyword “indramat” increased by 45.05%
- Visits via the keyword “rexroth” increased by 26.32%
The site with a blog simply performs better.
We added Google Analytics when we redesigned the second site, so we do not have year-over-year data for the redesigned site, though it has been online for many years. However, we have year-over-year data for the other site. Overall traffic increased by just about 3%, while unique visits fell by 3% — just about what Google saw in their benchmarks report. It showed nice increases when it received its Live Refresh and during a spell of social media management, and has stayed fairly steady since then. Our experience, and that of others in our field, shows that websites which do not have regular blogging, social media, and linkbuilding don’t see much change from year to year.
How is your website performing? Would you like to find out? Contact us and we will be happy to help.


Leave a Reply