Your cart is currently empty!
May 2013
-
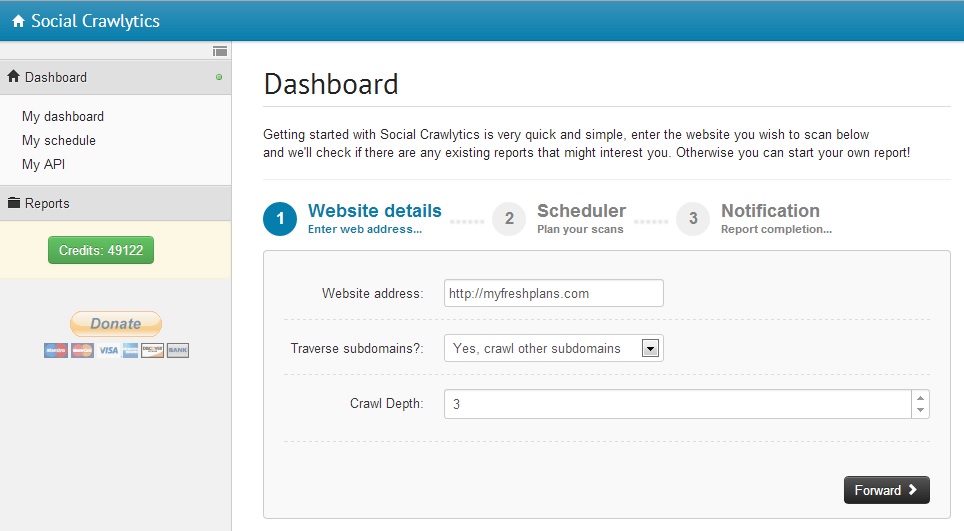
Social Crawlytics
One of the persistent problems with social media marketing is the difficulty of measuring its effectiveness. A new tool called Social Crawlytics is trying to help with that. Social Crawlytics takes a different approach from other social media monitoring tools: it doesn’t look at the reach of your tweets or the number of Likes you’ve…
-

Picky, Picky, Picky
We’ve had two clients apologetically say they were being picky in the past week. In one case, it was about describing a plane as “our plane” when they actually charter the plane. The other was about making a phone number a bit larger.
-

Rich Snippets and Structured Data
Traditional site design and development uses HTML tags to identify parts of a website and how those parts should look. You can specify the header, content, and footer along with many other things. These traditional HTML tags don’t provide much context for the meaning of the information inside them.
-

Is Google De-Indexing Blogs?
No. We heard this rumor and checked it out right away. After all, blogs are not only an important source of information and entertainment on the web, but also an important marketing tool. In fact, Google is de-indexing “private blog networks.” These are networks of blogs that allow you to post a single piece of…
-

The Power of Why, By C. R. Weylman
The Power of Why: Breaking Out in a Competitive Marketplace, is a new book from C. Richard Weylman. There’s a lot in this book, and I’ll be reviewing it at Amazon if you want to learn about all of it. However, there are two aspects of the book that I want to share with you…
-
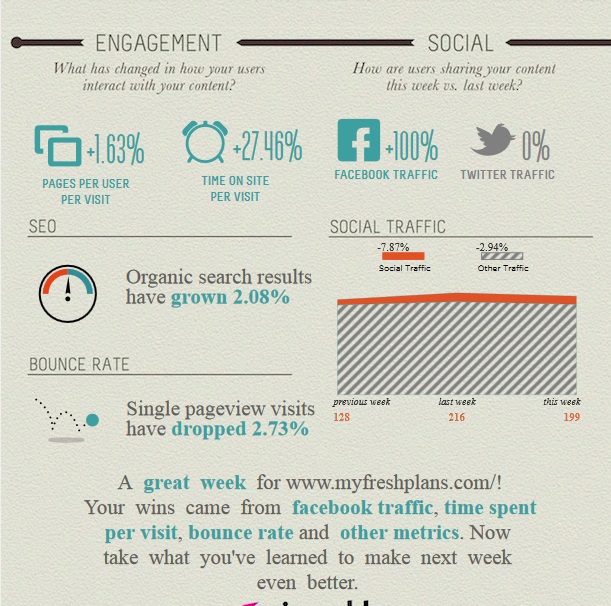
Google Analytics in an Infographic
This nice infographic is the result of a new service from Visual.ly: your own personal Google Analytics infographic. Once you sign in and give permission, Visual.ly will pull data from the past week at Google Analytics and populate the fields in the chart for you.