Your cart is currently empty!
Google Analytics Audience Overview
How many of your patients or clients visit your website? How do they find you? Which pages do they go to? Which ones do they share on social media? Are you seeing more traffic over time? How long do visitors stay at your website, and how many pages do they read? Google Analytics will tell you all these things — but only if you have it installed on your website. And only if you look for the information.
Google Analytics has recently made a big change in their main metrics: the Audience Overview report. This is the report that shows you how many people visit your website and how engaged they are.
If you pay a little bit of attention to your analytics, this is probably the report you go to most often.
If you never check your analytics, it’s a great time to go and have a look. (And if you really don’t want to, we’ll be happy to help.)
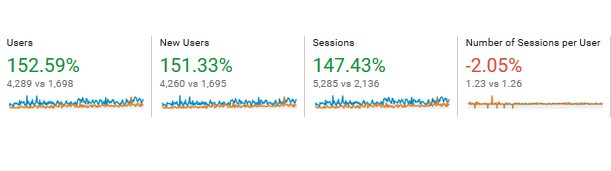
This is how it looks now:

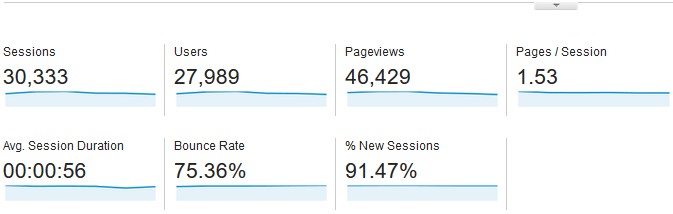
This is how it looked before:
Not only are there different metrics, but they’re in a different order.
Before: Sessions and Users
The first pair of metrics used to be Sessions (the number of visits to your website) and Users (the number of individuals visiting your website). Now the Audience Overview report starts off with the number of Users and the number of New Users. We no longer see the percentage of new sessions.
The second pair of metrics is now Sessions and the Number of Sessions per User. The focus is more on the individual user, and then on the total number of visits. We see how many times our average visitor came to the website during the period of time we’re examining.
Both New Users and Number of Sessions per User are new metrics. However, you can see comparisons between current and past numbers for these metrics.
If you’ve been using Percent of New Sessions as a Key Performance Indicator, you’re out of luck (or will have to do some math). Otherwise, you can probably use the new metrics just as you have been using the old ones.
Before and After: Engagement
Engagement metrics haven’t changed. They may be new to you, though, so here’s a quick explanation of these items.
Pageviews tell us how many times a page has been seen, whether by the same person coming repeatedly or by new visitors. This tells us the popularity of specific pages and posts. It gives us a good sense of the reach of a page.
Sometimes this may be a page that people bookmark, or our homepage which comes up when they type in our URL, but our Pageviews give us a good basic measurement of the popularity of our website over time.
Pages per Session tells us whether people explore our website when they visit. Are they coming to read a single article or to get the answer to a specific question? Or are they looking at a number of products or posts? We usually see numbers between 1 and 4 for this metric, depending on the type of website. A higher number can mean that your visitors are reading your content and wanting more — or that they have to go to a number of pages to get the one piece of information they wanted.
Average Session Duration tells us how long visitors stay at our website, on average. We know that people decided within 4 to 12 seconds whether to stay at a website or to leave, so this number is likely to be smaller than the amount of time it takes to experience your website. People who clicked through to check your hours are averaged in with those who stay and shop or fill out forms.
Bounce Rate is the percentage of people who visit only one page. We like to see a lower bounce rate, but there are many good reasons to visit a single web page.
For all engagement metrics, progress over time can often tell you more than a single measurement. These metrics may also give you more information when combined with other reports. For example, visitors from paid search might spend more time on your website than those who come through social media links. Or people who visit lots of pages may be more likely to sign up or to make a purchase.
Check out the new look at the Audience Overview report in Google Analytics. If it doesn’t speak to you, let Haden Interactive identify the actionable information in your analytics.

by
Tags:
Leave a Reply