Your cart is currently empty!
New and Returning Visitors
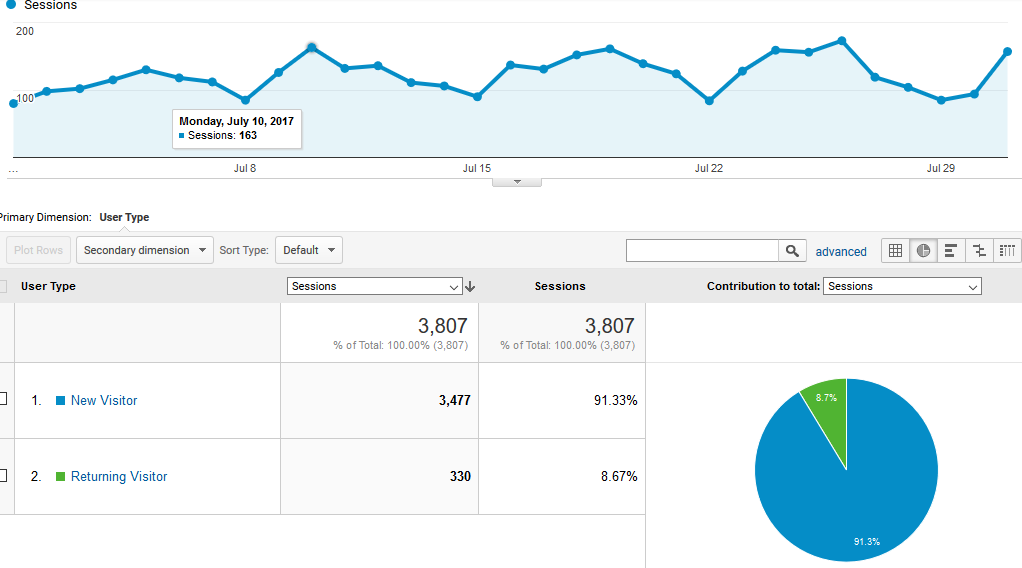
The screenshot here shows one metric from the Google Analytics report of our lab site, FreshPlans. You can see that we have 91% new visitors. You can find this report in Audience> Behavior> New vs. Returning.
So what? Google’s red and green color coding tells us that they consider increases in your proportion of new visitors a good thing, but is this always true?
New vs. returning visitors
Google Analytics recognizes visitors when they are logged into their Google account. They also recognize the devices visitors use. Say you find this website for the first time on your desktop at work, and then visit from your laptop at home. If you’re logged in, that second visit will show you as a returning visitor. Otherwise, both visits will show as New visitors.
Analytics tracks returning visitors with cookies. Some people turn off cookies. Analytics is also actually tracking computers, not people. That doesn’t matter if your visitors have a one to one person-computer correspondence.
The visitors to our lab site, we know from subscribers’ emails and from the networks reported in our analytics, are mostly visiting us from schools. At schools, individuals may use different computers on different days. They may have a computer in each classroom and use more than one classroom. They may use their phones or tablets as well as classroom computers. Many people typically use each computer, too, so the chances are good that we have new visitors showing up as returning visitors, and vice versa.
This data may not be very accurate for our lab site, because the audience is not typical.
Patterns of new and returning visitors
We look at a lot of analytics, so we know that 80-85% new visitors is typical. Most websites we see have this kind of profile. If you see numbers similar to these and not much change over time, you have a typical pattern going on.
What if your website is different?
There are several reasons that you might have fewer new visitors:
- If people do things on your site, you might have lots of repeat visitors. We see about half new visitors at banks, churches, and websites with tools people come back to use. We often see this when a site has a patient portal, too.
- You might not be filtering your workers out of your analytics. You should. Your staff will show up as returning visitors, as they look for information or show customers your products repeatedly during the day, and their visits will skew your results.
- You might actually not be drawing new visitors to your site. One client we had relied heavily on a members-only forum at his website. It was very active and converted well for him, but he wasn’t seeing new people coming to his site. Linkbuilding helped.
If you rely on your site for leads and sales, you want to encourage people to return, but you also want new visitors.
If you want more returning visitors, these are some steps you can take:
- Encourage visitors to subscribe.
- Use remarketing with your Adwords.
- Encourage visitors to connect with you on social media.
However, you should look at your Frequency and Recency Google Analytics report to determine whether your visitors are returning as much as you’d like them to.
Page by page
You can also check to see which of your pages are drawing new visitors, and which are drawing more returning visitors.
Go to Behavior> Site Content> All Pages and set the Secondary dimension to User Type. This will show you page by page how many new and returning visitors reach each page.

This information can help you make sure that new visitors are seeing the kind of basic information they need. If, for example, your page on headaches and chiropractic receives a high percentage of new visitors, you know that you should include –or link to — basic information on chiropractic and the chiropractic lifestyle.
If you have trouble getting this kind of actionable information from your analytics reports, let us help.
by
Tags:
Leave a Reply