Your cart is currently empty!
New Look at Google Analytics
Your Google Analytics dashboard has a new look. Today we’re offering you a first glance, and we’ll be going into more depth throughout the week.
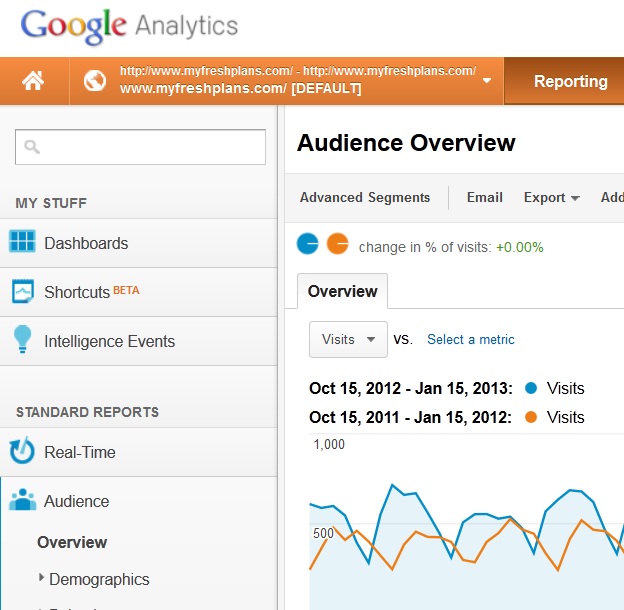
The first thing you’ll notice is the new “My Stuff” section, where you can set up a dashboard that includes the metrics that matter most to you. You’ve had this option before, but it’s more visible now. There is also a new Shortcuts option, which lets you create new tabs for metrics that matter most to you.
For example, this data is from FreshPlans, our lab site, which has an international audience. Our visitors’ locations aren’t especially important to this website. For a local business that’s working to increase the percentage of local traffic, location would be very important. This site doesn’t use ads; for a website that’s investing in pay per click, seeing how the ads perform would be key. Being able to set up custom dashboard and shortcuts will be a big help for a lot of people.
Intelligence Events — things Google finds surprising about your traffic — are also more accessible and they are shown in a form that’s much easier to grasp.
With the new, simpler format, we can quickly and easily see that traffic dropped severely over Thanksgiving weekend. This is not a surprise to us, but it’s good to know — if it weren’t a predictable seasonal variation, we’d need to explore further and figure out what was happening.

Continuing down the left edge of the dashboard, we see that real-time reporting and standard reporting (which used to be on tabs along the top of the page) are now the next options:

Audience, Traffic Sources, Content, and Conversions should be familiar, though there are some new reports for paid advertising (one that lets you compare costs easily should be a benefit for those using a variety of paid sources) and for Adsense.
Jump in if you haven’t yet and see what’s new on your dashboard. Come back tomorrow for more details.
Leave a Reply