Google Analytics has a new look! Known as GA4, the new reporting is quite a bit different from what we’re used to. In the new Google Analytics interface, Engagement has its own set of reports.
You can see the various engagement metrics in Universal Analytics under the Audience Overview report. Number of sessions per user shows the average number of visits from each user. In the screenshot below, showing a week of traffic at our lab site, we had a little more than one session per user.
We can see that the average number of pages visited by each user was 1.37, and the average amount of time for a visit was just under one minute. Our bounce rate (the percentage of visitors who went to just one page) was 82.57%.

This can give us an idea of how engaged our visitors are, and we can work to increase engagement from that point.
The GA4 Engagement report

The new Engagement report includes an overview report, plus Events, Conversions, and Pages and screens, and Landing page. The opening page shows us that the average engagement time at this website is about 44 seconds — this is still our lab site, but the week shown here had an average engagement time of about 10 seconds less. This report also shows which pages the most recent visitors have seen.
The Engagement overview report shows us the time on site, plus the number of engaged sessions, which is less than one session per user. It also shows us the average engagement time per session. It’s a little confusing that the average user had fewer than one session, but it makes sense that the time per average session would be lower than the time per user, since there is fewer than one session per user.
Events
In the screenshot below, we can see the Events report. GA4 is all about Events, whereas Universal Analytics was all about sessions. This report lists some of the events being tracked: a page view, the start of a session, a click, and so on.

In addition to the events listed above, you could also look at occasions when users play a video, download a PDF, send in a form, use a store locator, and lots of other things. You can create your own events, too (in Admin — more on that later in the series).
You can track events in Universal Analytics, but it requires extra code at your website. You also had to set up all events in Universal Analytics. GA4 automatically tracks some basic events for you. This is a big difference between the old and new interfaces.
Tracking events allows you to determine whether people watch a video on your website, for example. You can see whether people watch once or repeatedly and whether they watch before or after downloading a document or submitting a form.
Conversions
The new interface has a separate report for conversions. You can define any event as a conversion in the Admin area of your Analytics account. Simply go to the “Events” section and mark an event as a conversion, as shown in the screenshot below.

You have the option of copying goals from Universal Analytics into the Conversions area of GA4 (until July 1). We set up a few events as conversions and the screenshot below shows a few days of those conversions. We have not yet set up the revenue data.

Remember, a conversion does not have to be a sale. It could be a visit to a store locator, booking an appointment, filling out a Contact form, spending a certain amount of time on a particular page, adding an item to a cart, or making a donation.
Pages and screens
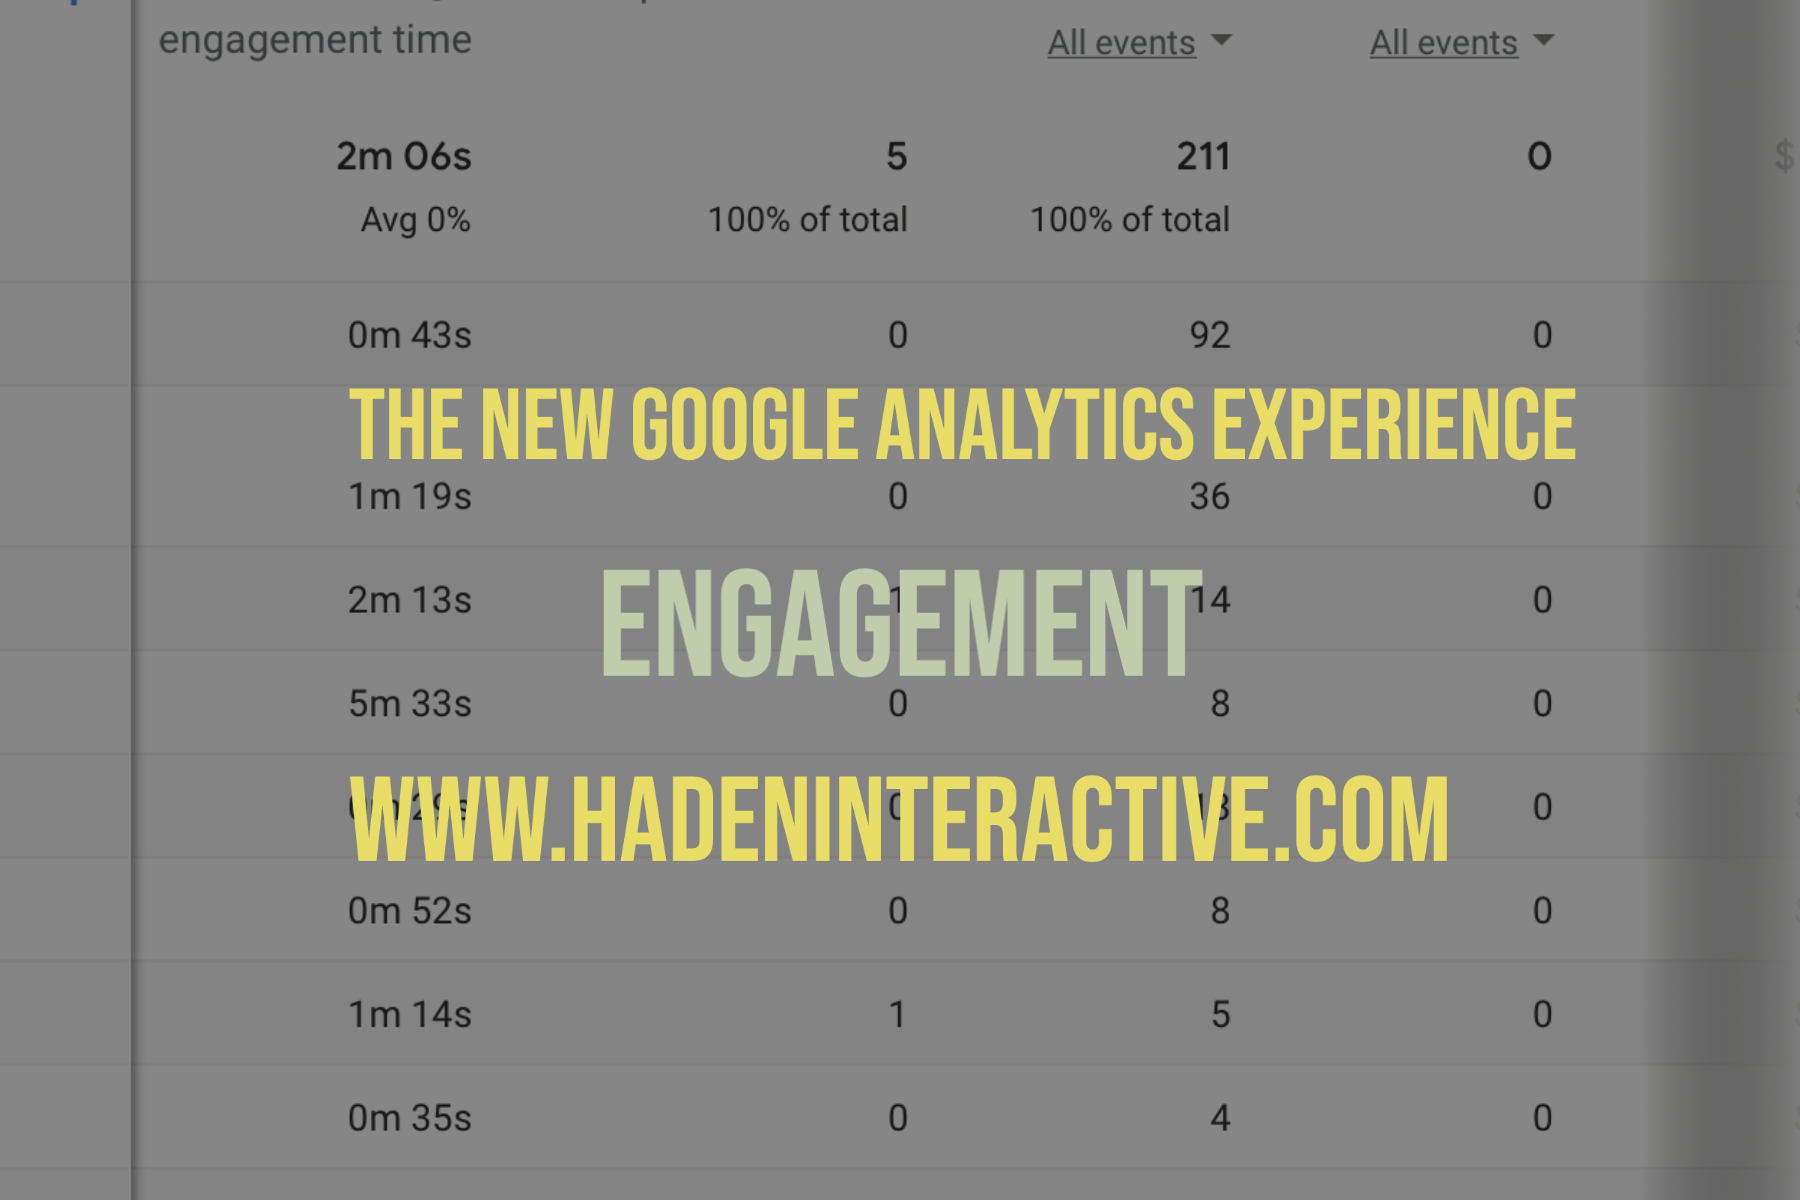
The pages and screens report shows engagements on specific pages. The screenshot below shows some of the data presented for each page.

Scroll down below these quick charts and you will see a table of data for each of the most popular pages.

It shows the number of visitors and the time they spent engaged on the page. It shows the total number of events that took place on that page, and you can use the drop down menu to get the specific events that took place on the page. It also shows conversions and revenue once you set them up.
Landing page
The Landing page report looks specifically at the pages people start with when they first come to your website. The Pages and screens report shows all the pages and screens being visited, but Landing pages are the ones that bring people to your site in the first place.

At most websites, most of the time, the homepage will be the most common landing page. At our lab site, however — and maybe your site as well — people are more likely to arrive at a blog post via organic search than to head right for our homepage. The screenshot above, showing the month of June, shows that summer classroom themes are popular, but our Juneteenth Lesson Plans page became much more popular than any other page as we moved toward that special day. We always see traffic drops over the weekend, and we see that in this chart, but we also see that nearly vertical line showing the visits to the Juneteenth page on June 19th.
Below the chart is a table showing engagement data for the landing pages.
The GA4 interface gives you more information on engagement than you can easily get in Universal Analytics. It also sorts the information out, it seems to me, so that it’s easier to focus on specific kinds of engagement.
If you need a report that allows you to compare different kinds of product pages, for example, or different sales landing pages, this information could give you some very granular insights.
Leave a Reply