Your cart is currently empty!
The New GA: Retention
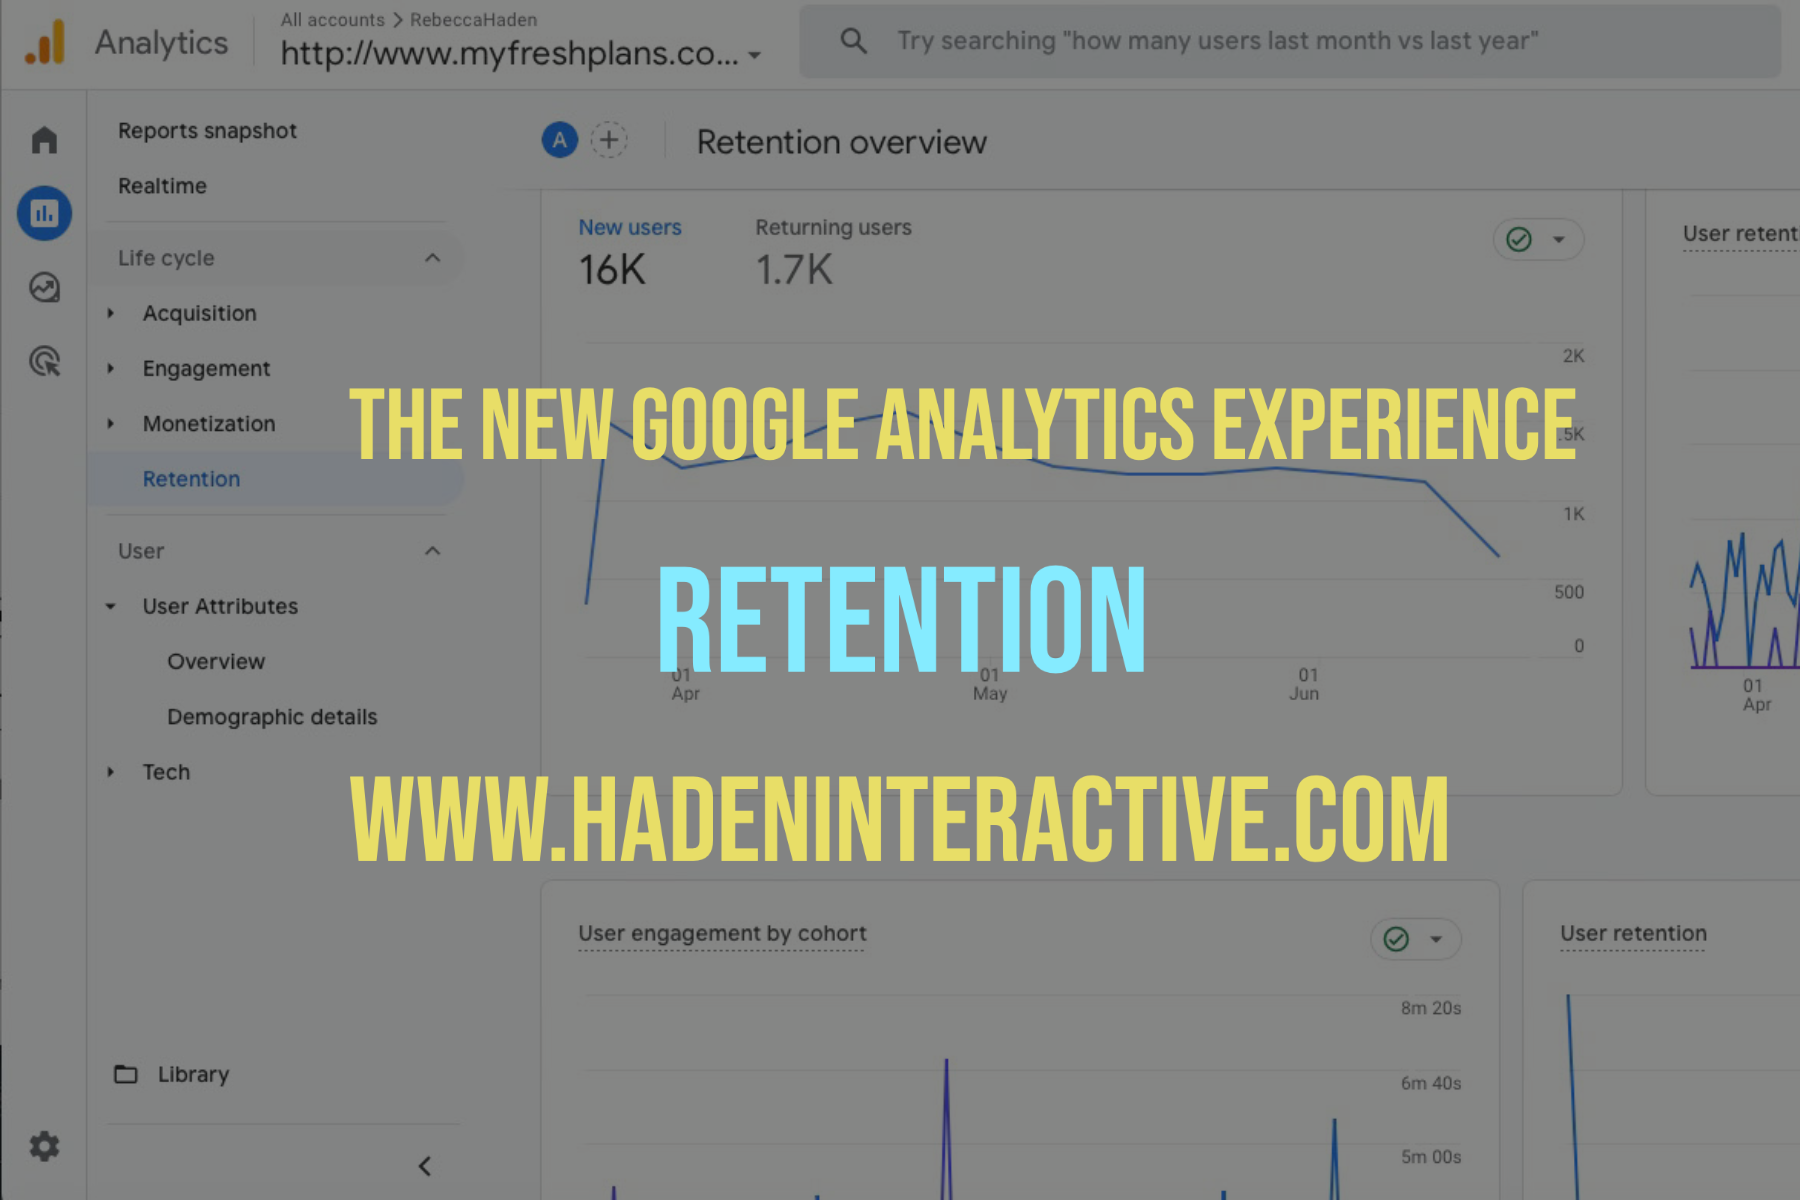
We’re examining all the reports in the new GA4 interface, and we’ve come to the Retention report. This report shows how well you keep visitors coming back to your website.

We begin with the proportion of new and returning users. We can see that this website has far more new users than returning users. This is generally a good sign, but the balance you want depends on your goals. If you sell a high-ticket item and you know that the path to purchase tends to take place over a period of weeks or months, like a knee replacement, you will want more returning visitors. Equally, if you sell something that can be a regular purchase, like skin care products, you want return visitors. If on the other hand you offer a once in a lifetime purchase typically made on the spur of the moment, you want as many new visitors as possible. This is an oversimplification, but it should give you a starting point to think about the difference.
The retention details
Next we see the user retention by cohort. A cohort, in this case, is the group of visitors who came on a given day. The top line shows this: visitors on Day 1. The other two lines show how many of those visitors had come back again by Day 8 and then by Day 30. We can see that the number of people coming back a month after their first visit is smaller than the number who came back after one week.

User engagement by cohort shows how much time the visitors spent. If they were on the site for 47 seconds on Day 1 and 15 seconds on Day 7, that tells us that they are less engaged )or at least staying for a shorter time) when they come back.
User retention show visitors over the course of their first 42 days. This chart always starts at 100%, because all of the visitors come to the website on their first day. The numbers drop over time, as some return but others do not.
The User engagement shows the average levels of engagement over the first 42 days.
Finally, if you are tracking revenue, you can see the lifetime value of a visitor. As always, this is aggregate data and you can’t see how much John Brown has ever spent with you, but you can get a good idea of what benefit you will see if you add a new customer.
What to do with your retention report
We see a wide range of figures across properties. If we had to pick a number, we’d say that most of the properties we see have somewhere in the neighborhood of 10 times as many new visitors as old visitors. However, we see that frequency and levels of engagement become higher at some sites and lower at others over time.
Since different websites have different goals and audiences, you might benefit more from one pattern than another. This report helps you to determine whether you are going in the direction you want to go in or not. Keep track and compare your current results with your past results and on into the future. Keep track of the efforts you make either to bring visitors back more frequently or to gain more new visitors. As you reach those goals, you can develop strategies to keep going in the same direction or to change.
by
Tags:
Leave a Reply