Your cart is currently empty!
The New GA: The Tech Report
The Tech report at Google Universal Analytics gives you a lot of information about your visitors — and used to give more.
It tells you the devices your visitors use, as well as their operating systems and browser choices.
An operating system is something like Apple MacOS or Microsoft Windows. A browser is something like Chrome or Safari. This information could give you some ideas about the age and occupation of your visitors, although it’s no longer as clear cut as it used to be.
The Universal Analytics Technology Report
The screenshot below shows the devices visitors to our lab site used, in the Universal Analytics view. We can see that the iPhone is far and away the most popular device among our visitors. We need to make sure the website looks good on an iPhone.

The next shot shows the browsers our visitors use.

Chrome is the most popular, followed by Safari. The market share chart below shows why this isn’t giving us any real insights into our visitors.

Source: StatCounter Global Stats – Browser Market Share
It mostly just tells us that, like all the other computer users in the world, our visitors use Chrome most and then Safari.
Once upon a time, Google Analytics used to tell us about our visitors’ networks, as shown in the screenshot below.

This was a very useful report, but Google no longer shares this information with us, so it is not included in the G4 view.
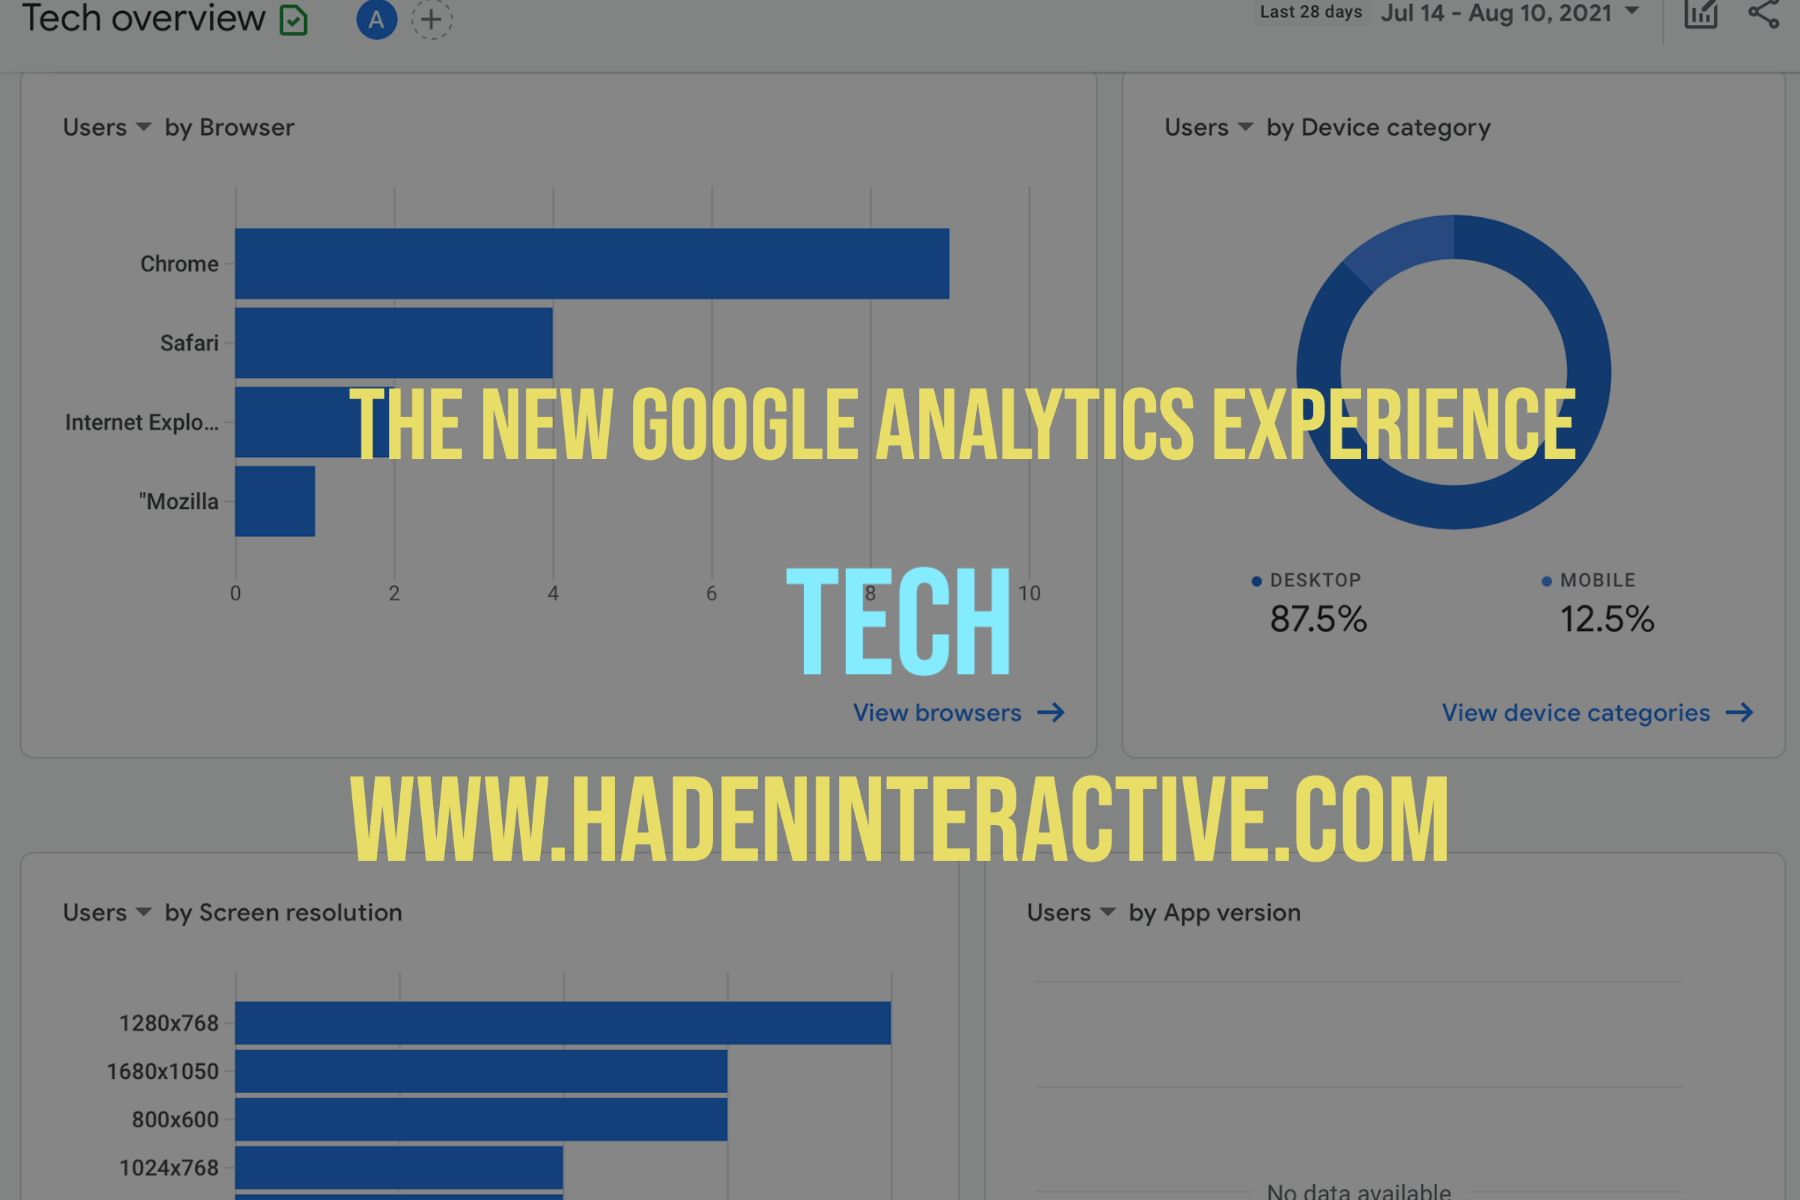
The GA4 Tech report
The new G4 report shows us an Overview, which gives us the platform (web or app), operating system, and browser of our visitors.

Scroll down and you can see screen resolutions and devices.

If you’re tracking an app (which our example is not), you can also see the app version, latest release users, and the percentage of users who have used your app crash-free.
Move in on the Tech details report and you can see the level of engagement according to browser choice, as well as any changes in the operating system and browser information.

What’s this information good for?
It’s probably more useful for planning and building a website than for day to day strategy decisions. However, this information can alert you to tech issues at your website. For example, if visitors using Firefox are much less engaged than those visiting with Chrome, your website might not perform as well on Firefox.
However, bear in mind that it’s nearly impossible to get identical results on every browser and operating system. If you have your web people perfect the look and feel in Firefox, it might not be as great in Chrome any more.
Check the number of visitors you have in the various operating systems and browsers before you decide to invest heavily in Internet Explorer. For our lab site, it was 0.13% of the traffic — not worth putting a lot of time into.
You should also check this report before you accept the conventional wisdom that “everybody” is visiting your website by phone. Some sites see just that pattern, but not all. Our lab site, for example, still has majority desktop users. Our visitors are mostly young, but they are also mostly teachers, visiting from their classrooms.
This report may not be one you check daily or weekly or even monthly, as a website owner, but it’s worth checking occasionally to see if there are any surprises. For example, we once had a client who had visits via Playstation; chances are that client’s visitors included teenagers.
by
Tags:
Leave a Reply