Your cart is currently empty!
The New Google Analytics Experience
Google Analytics has a completely new look! If you haven’t checked out the new Google Analytics experience, you might need a guide to help you along the way.
What’s different?
Here’s one Google Analytics report that may be familiar: the Acquisitions Overview report, showing how visitors found their way to our website.

We’re looking at a month of visits to our lab site. A pie chart shows us that Organic Search (blue) brings us nearly all of our traffic. 12.4% of our visitors come directly (green) and we have an orange sliver of social traffic.
Line graphs show us the number of visitors and the number of e-commerce sales. Below those three charts is a bar graph showing more detail about the sources of traffic.
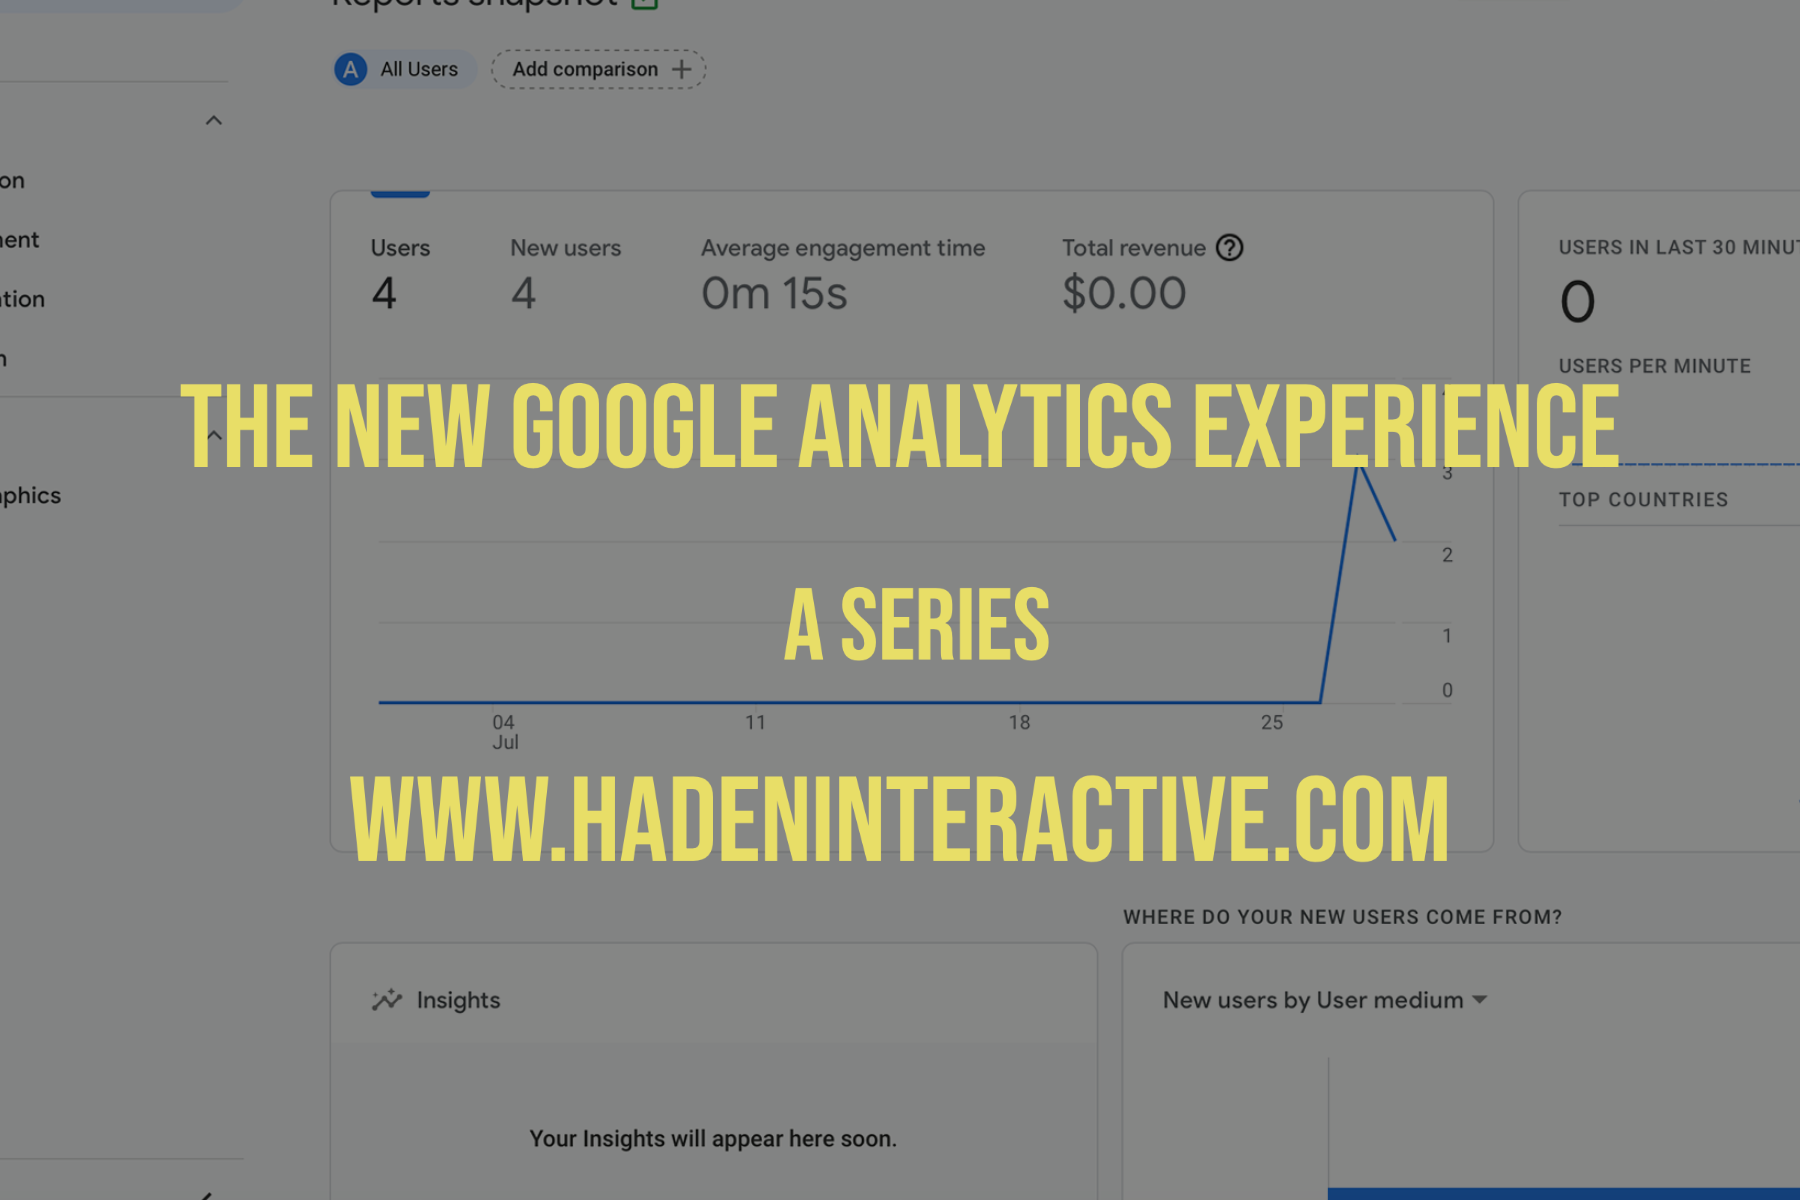
The screen shot below shows us the new Traffic Acquisitions report for the same website and roughly the same time period. “Roughly” because Universal Analytics shows 30 days and GA4 shows 28.

Top left there’s a line graph showing the visitors to the website. Next to that is a bar graph showing the visitors in the last half hour. Below that we get more details on traffic sources.
Both reports show
- the number of visitors
- the source and medium of the visits
- the number of sessions
- the length of time spent
- the number and revenue of conversions
But the information is in different places, with different kinds of charts. The reports are different enough that you won’t be able to read the new reports easily just because you can read the old reports. The new Google Analytics experience is definitely new!
First steps
Let’s start with the basics. What reports are in the old analytics? Look on the left in the screenshot below and you will see Realtime (the visitors who are at the website right now), Audience, Acquisition, Behavior, and Conversions.

Each of those reports has a drop down menu showing more details.
The screenshot below, showing the new GA4 reports, offers two major divisions below the Realtime report.

Life cycle includes Acquisition, Engagement, Monetization, and Retention. User shows User Attributes (Demographics) and Tech.
As we know from comparing the two Acquisitions reports, having the same name doesn’t guarantee that the old and new reports are covering the same things in the same way.
Step by step
Universal Analytics will stop collecting data at the end of June, 2023. You have just enough time to migrate your Universal Analytics account to GA4 before that deadline. If you need help, we will be glad to assist.
by
Tags:
Leave a Reply