Your cart is currently empty!

What’s New with Google Analytics
I’ve been preparing third quarter Google Analytics reports for clients — and yes, I’m usually through by now, but the joint has been jumping over here, so I have a few more to finish up. So I’m racing along trying to be as efficient as possible, and there it is: a completely new dashboard at Google Analytics.
I’m not complaining. When Google makes changes in Analytics, it’s generally an improvement. But you may find that… well, that you can’t find your stuff.
Let’s have a look at the new look at Google Analytics.
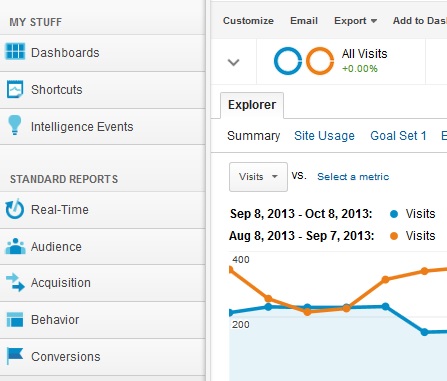
 The first thing you’ll notice is that the navigation has changed. Instead of Traffic Sources you’ll see Acquisition. That’s followed by Behavior, which includes Site Content.
The information you’re used to is still there, but it has been rearranged.
Before moving on to the new reports, let’s just run through the main navigation, in case it’s been a while since you took a look at your analytics.
Dashboards lets you see the essential metrics for your website fast. You can use the standard dashboards or you can create your own.
Shortcuts let you jump quickly to specific reports. For example, we blog for a client who gets regular visits from the Executive Office of the President, and they like to know which posts the president or his staff have accessed. Naturally, this isn’t a standard report in Google Analytics, but we can set it up and save it as a shortcut for this one client.
Next come Intelligence Events, surprising changes in the pattern of usage of your website. This is where Google alerts you if there has been a big change in traffic patterns, and you can set up your own alerts too.
The Standard Reports begin with Real-Time, where you can see what’s happening at your website right now. The average website doesn’t have enough traffic each day to make this an important element, but a news site or a high-traffic site can respond quickly to data collected here. Conversions and Events have been added.
Next comes Audience: where your visitors come from, what languages they’re using, their level of engagement, and what kind of devices they’re using. This is also where you can find the old Behavior section — new vs. returning visitors, how often visitors come, and so forth. You’ll find Networks and Visitor Flow in this section as well.
Acquisition replaces Traffic Sources. Here are the items included, with the new items noted:
-
Overview NEW
-
Channels NEW
-
All Traffic
-
Campaigns
-
Keywords
-
Cost Analysis BETA
-
AdWords
-
Social
-
Search Engine Optimization
Acquisition Overview is a new report. It lets you see the source, engagement, and conversion rates of all traffic in a quick chart. This lets you see at a glance that, say, Facebook sends you traffic but the visitors don’t convert, or that your referral traffic is highly engaged. You can break it down by source and medium if you like. This report speeds up a lot of comparisons you might have been doing manually.

The Channels report is also new. It shows the traffic sources in greater detail, breaking down specifics for each channel by day, week, or month.

Acquisition includes the old reports on social media, campaigns, and SEO. It also has a Keywords report, broken into Organic (most of which will now be not provided) and Paid, which shows your PPC/CPC keywords.
Behavior is the next category of reports. Here you will find the familiar Site Content reports, including Events, Experiments, and In-Page Analytics.
Finally, you have Conversions, where you can track goals you’ve set up. This section has not changed in the new updates.
Go on in and poke around a bit to get familiar with the new system. Don’t miss the Analytics Education sections if you need help. Clicking on the little mortarboard in the upper right hand corner will get you video lessons on how to use the various sections.
We’re looking forward to getting to know the new reports. If you need any help, don’t hesitate to call on us.
by
Tags:


Leave a Reply