Your cart is currently empty!
10 More Things to Look at in Google Analytics
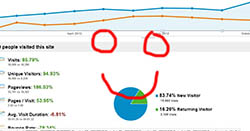
A while back I was looking at Google Analytics with a colleague. “Clients don’t want to know about their analytics,” he said. “Here’s what clients want to see.”
He reached for his mouse and drew a red smiley face over the screen.
It’s true that plenty of people don’t like analytics much. If traffic is up and business is good, that’s all they need to know. I’ve had a surprising number of clients assure me that looking at analytics makes them feel as though their heads are about to explode.
Let’s say that you’re one of the intrepid few, though. You’ve mastered the basics and you’re ready for new adventures. Here are 10 things you might not already have looked at:
- Location Are your visitors coming from your service area? Go to Audience>Demographics>Location and find out. Click through to your service area and check under Visits to see what percentage of your visitors come from the geographic area where you work. If you only serve one county and you have only 13% of your visits coming from that county, your happy face for increased traffic is deceptive.
- Network Go to Audience>Technology>Network. Most of the networks you find there will be public internet service providers like Verizon or AT&T, but if you scroll down the list you may see something interesting. You can discover things like whether people tend to visit from work, whether your website is used for research, and whether particular kinds of companies are following you. If your customers are enterprise level, you can even see which of your potential customers might be visiting your website repeatedly — a good reason to put them on your Dream Client list. (One of our websites had visits from “the executive office of the President” this year, which we thought was cool. Maybe yours had some visitors who would liven up your day.)
- Browser/OS While you’re in Technology, have a look at the browsers. The typical website sees most visitors coming to their website with Internet Explorer — especially if people visit you mostly from work and you have a corporate audience. Here at Haden Interactive, IE brings us only 12% of our visitors. Chrome is over 38% and Firefox brings about 35%, so we’re looking at a more than usually tech-savvy group — or people who get to choose their own browsers even at work. Not a corporate audience. It’s a mistake to stereotype on the basis of browser choice, but it’s probably as good a way of making guesses about your audience as more common demographics.
- Engagement This might be new to you because it’s fairly new — it’s the new report on the length of time people spend at your website and the number of pages they view. Go to Visitors>Behavior>Engagement and notice that there are two tabs. We typically see a C shape, with more people making brief visits, fewer in the middle, and then a second larger grouping making long visits. This metric doesn’t necessarily tell you much about your visitors, but it gives you a benchmark from which to improve. Note the levels of engagement now, check the levels for individual pages, change and test to increase your engagement.
- New vs. Returning You’ll find this report in Visitors>Behavior. Add a Secondary Dimension to discover what sources new and returning visitors use to find you. Is Facebook bringing you almost as many new visitors as Google? Then you should make sure that your Facebook posts continue to speak to new people, as well as to the friends you’ve made there. On the other hand, if Facebook isn’t bringing you anyone new, it might be that your Facebook posts aren’t appealing to folks who don’t already know you. Fix that and you may see more new traffic.
- Mobile If you haven’t already, check Visitors>Mobile>Devices, and see what percentage of your visitors use mobile devices to reach your website. This number has increased significantly this year for most of the sites we care for, and you may see the same thing. Check our suggestions for mobile visitors to find next steps if your mobile visitors are becoming more important to your website.
- Visitors Flow This is one of the most underused and yet valuable sections of Google Analytics. You’ll get a graphic representation of the way visitors move through your website, and you can drill down for lots more details. Read our post on Visitors Flow to find out how to begin using it.
- Network Referrals You probably already know whether your own Twitter or G+ accounts sends you traffic, but you might not be aware of the traffic you get from other people’s social shares. Go to Traffic Sources>Social>Network Referrals. Our lab site shows referrals from places like Squidoo, Tmblr, Diigo, and Ning, even though we aren’t there ourselves. You’ll also find referrals from blogs, forums, and such — anywhere people are talking about you. We’re seeing sites with nothing but Facebook and LinkedIn, and sites with 25-35 different listings here. This area will tell you whether you’re getting talked about, which networks are working best for you, and how your own efforts are doing. It can help you establish baselines for linkbuilding and social media and give you an idea of whether your content is interesting enough to create buzz — if buss would be useful to you.
- Search Engine Optimization In order to use this data (find it under Traffic Sources), you have to hook up Webmaster Tools with Google Analytics. Once you do this, you can see how many times Google has offered your website for various queries, and what position you were in on the page. I hope you know by now that looking things up at Google and seeing your website at some position means nothing much. This section of analytics tells you where, on average, your website was for various keywords when it was shown to searchers. This is the place to get accurate information on this subject.
- Site Speed Google would rather direct people to faster sites than slower ones, all things being equal. If you have any competitors online, that means that you need to have as fast a website as possible. Check the Site Speed report under Content to find out which pages load slowly, and have that fixed. Note that you can segment out different devices (if you have enough data — not all websites do) to see if your mobile visitors are loading slowly and skewing your results.
Leave a Reply