Your cart is currently empty!
Customizing Your Analytics Dashboard
The new Google Analytics interface lets you set up multiple custom dashboards easily. You can use the default dashboard and also set up dashboards that will show specific information you need on occasion — say to prepare a monthly report. You can set up a dashboard for traffic and SEO data for daily use by your marketing people, and also set up a dashboard showing revenue and sales for your financial or sales people.
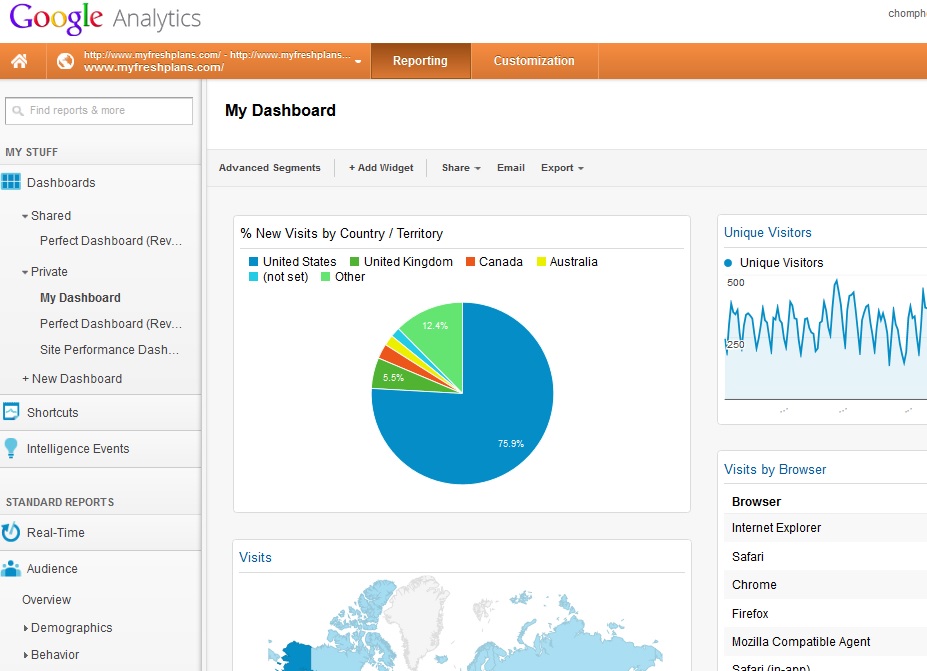
The dashboard is set up as a collection of widgets, each one showing a single report.The default dashboard has the ones that are most popular for most people, and they can give you a great quick oversight of your website’s performance.
If there are some widgets on the default dashboard that don’t give you useful information, you can remove them to make space for others that are more suited to your needs.
Just hover over the top right hand corner of the widget and you can easily edit or delete a widget. In this case, our lab site, FreshPlans, has no revenue stream, so this widget doesn’t provide any value. We removed it.

Once you remove the widgets you don’t need, it’s a simple matter to add those you do need. Click on “Add Widget” at the top of your dashboard.

You will see a screen that has drop-down menus which allow you to choose from many metrics, and to associate them with many more dimensions.
You can also choose the type of graph that will be most useful for the data you’ll be checking. You can filter your data, and add a link to a report or to a URL.

Choose the metric you want to track.

Choose the dimension you want to use to sort your data.

Click Save and you’ll have the new widget on your dashboard.

It’s that easy!
Related posts:
Comments
One response to “Customizing Your Analytics Dashboard”
Google Analytics Widgets Which one to use, When, How, Why –
http://www.digitalmarketinganalytics.net/google-analytics-databoard-widgets-which-one-to-use-when-why-how/
Leave a Reply