Your cart is currently empty!
Google Analytics: Query vs. Keyword
We know that many people are still confused by keywords, and now you also have queries to contend with. Let’s look at both and see what each gives us in the way of data.
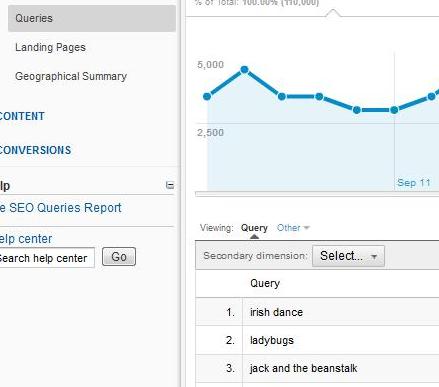
Queries are in the new Search Engine Optimization section of Google analytics, in the Traffic sources division. At right you can see where to find this report. You will only be able to see this if you have Webmaster Tools for your site, and if you have hooked them up with your Analytics.
This is our lab site, FreshPlans, and this is a section of the first screen we see when we look at the Queries report.
Oddly enough, the #1 query for this site is “irish dance,” followed by “ladybugs” and “jack and the beanstalk.” While our Jack and the Beanstalk lesson plan page is one of our most popular, we don’t think we’re that well known for our posts on Irish dance or ladybugs. Sure, we have posts on both those subjects, but they’re not top pages, and they’re rarely in our top keywords.
This is because Queries doesn’t primarily measure information about our visitors. It’s really telling us about our site’s performance on the search engine results page.
Our Irish dance page is offered to 3,500 people a month, tied with the ladybugs page for the most commonly offered of our pages.
We don’t get 3500 visits to that page each month, presumably, because most of the people seeking information on Irish dance don’t want lesson plans about it. They want to watch it, or find other Irish dance aficionados, or something. So only 170 of the 3,500 people who saw this page on the search engine results page actually clicked through to read the page.
Queries and Keywords, then, are not the same thing in Google Analytics reporting. Now that we know what the terms mean, let’s look at the information each report offers us.
First, here’s the Keywords report for FreshPlans. You can click on it to see it larger. (Just a reminder — we never show clients’ data to anyone — FreshPlans is our lab site, which we built specifically so we could show the data to people.)

We see that, of the terms typed into the search engine boxes which actually brought traffic to our page, “stone soup lesson plans” was number one, and “irish dance” was clear down at number 4 — with 83 visits, not 170. Experienced Analytics users know that discrepancies between reports are common, and they can’t be fixed, so we should simply notice them and take them into account when we make decisions based on our analytics data.
The Keywords report also tells us how many pages people entering with the keyword visited, how long they spent on the site, and some other things, and we can always use the drop down secondary dimensions menus to refine the data further.
The Queries report, which you can see below, shows us a completely different set of data. The query “stone soup lesson plans” brought our page on the subject to people 500 times and 70 people clicked on it — not the 122 we saw in the keywords report. The average position shows where, on average, our listing appeared on the SERPs for the people who clicked on it.

With geotargeted search, instant search, and personalized search, it no longer means much to say, “We’re #1 on Google.” This report shows us that on average, for the people who were offered our page as one of the results for their query “stone soup lesson plans,” our listing showed up at #6.2, below the fold. While an average like this obviously includes both higher and lower positions, it’s interesting that this placement received more clicks than some of the #1 listings. In fact, these top 10 queries include both listings averaging #1.4 and a query averaging #12.
The Queries report also tells us the click through rate for each of the queries. In our top 10 queries, we see click through rates ranging from 8.57% to 44.81%. If you pore over the data, you’ll see that the correlations among the click through rate, the average placement, and the number of impressions are not simple and obvious.
Let’s look at that “Irish dance” query again. Google’s keyword suggestion tool says that in an average month, about 300,000 people search for “Irish dance.” This month (probably not a particularly high month for this query), over 10% of all those people were offered our listing, at an average placement of #10. Over 5% of those people clicked through to our page.
What can we conclude from this? I’d say we can tell that there aren’t a whole lot of good websites on Irish dance. After all, our page is designed for teachers looking for something interesting to study around St. Patrick’s Day — not, I assume, what 300,000 people are looking for when they type in “Irish dance.”
Take another example: “billy goats gruff lesson plans.” Not very many people look for this, but our average placement is #1 and 100% of the people offered our listing clicked through. They were wise to do so — we have, without question, the best page on the web when it comes to lesson plans about the Three Billy Goats Gruff.
Neither of these is likely to lead us to make changes in our pages (if for some reason you want to make a website about Irish dance,though, you can probably dominate search pretty easily). What kinds of results might give us actionable data?
We’re told that about 720 searches are made each month for “dia de los muertos lesson plans,” and our average placement for those to whom we were offered was #1. Yet no one at all clicked through. When I looked at the SERPs, I found that our listing says this:
“Dia de Los Meurtos Lesson Plans. Posted by Rebecca Haden on Tuesday, September 28, 2010 · Leave a Comment. Dia de los Muertos lesson plans. Celebrate …”
Not enticing, is it? Apparently, I didn’t bother to include a meta description. I need to fix that. Chances are, if you have high average placement and a low click through rate, your listing just doesn’t look very good on the SERPs.
On the other hand, a high click through rate and low placement may mean that you have a page that’s attractive to people and not to search engines — or a misleading meta description.
As with most areas of Analytics, you need to be looking for the surprises. Then you need to look for the reasons for those surprises. Then, if you want to see different results from what you do see, you need to make changes.
by
Tags:
Comments
3 responses to “Google Analytics: Query vs. Keyword”
[…] These guys helped untangle some of the subtle questions I didn’t know I had. […]
[…] These guys helped untangle some of the subtle questions I didn’t know I had. […]
[…] These guys helped untangle some of the subtle questions I didn’t know I had. […]
Leave a Reply